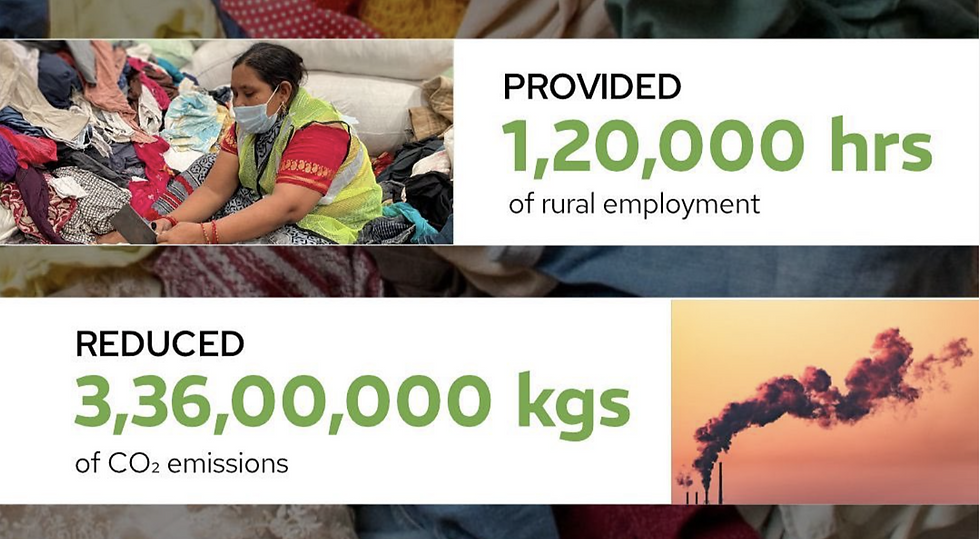
Data-Driven Sustainability: GHG Calculator for Waste Management
This collaboration with a data-driven waste management firm aimed to create a Greenhouse Gas (GHG) calculator in Microsoft Excel, quantifying emissions associated with their textile waste management procedures. Utilizing Power BI for data visualization and analysis, actionable insights were derived, enabling the client to pinpoint areas for reducing their carbon footprint and achieving sustainability gains. This solution boosted client acquisition and retention, driving significant business growth.
Tools used: Power BI, Microsoft Excel
Increased client acquisition, retention and sustainability metrics for the organisation

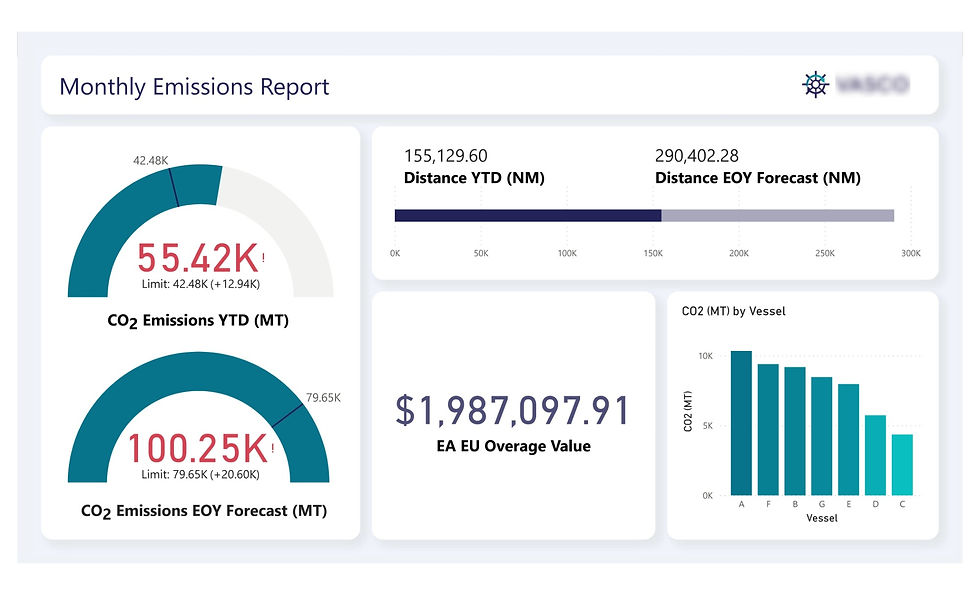
Shipping Emissions Insight: Power BI Report
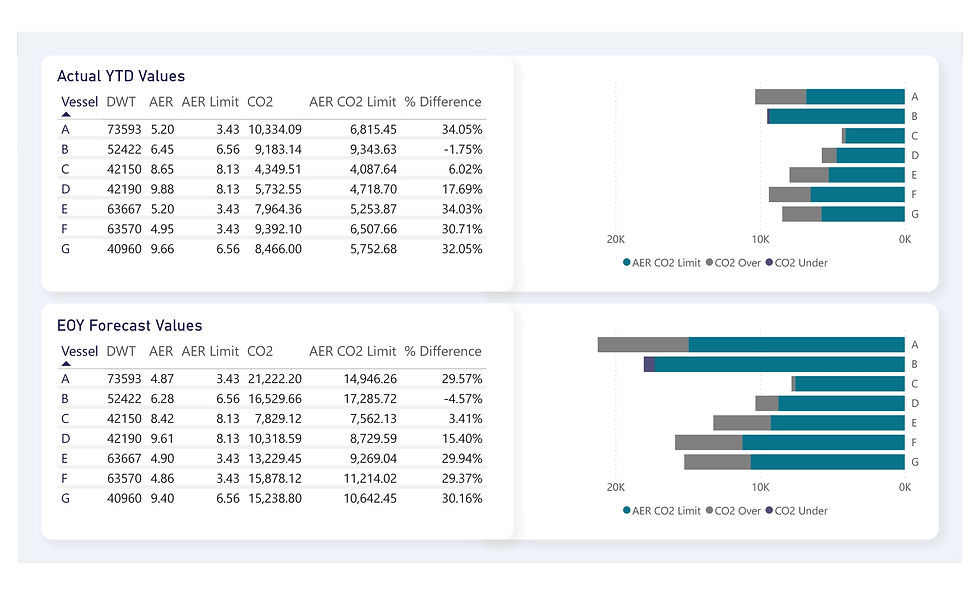
The project entailed the creation of a comprehensive monthly emissions report using Power BI for a shipping company. The client's requirement was to have an easily understandable and visually appealing report that provided insights into the current and forecasted emissions of their vessels, in adherence to set limits. Additionally, the report incorporated details on financial penalties incurred due to exceeding emission limits, alongside total distance covered by the vessels.
Tool used: Power BI
Simplified critical data into understandable visuals for the client. Click on the image to view the full report -->
User Engagement Analysis of Microsoft Viva Engage
This project involved conducting analysis on declining user engagement in Microsoft Viva Engage, an enterprise social network, using PostgreSQL to identify potential causes. The analysis revealed issues with mobile app and email newsletter engagement as the main contributors to the decline. Based on these findings, an actionable plan can be developed to address the engagement downturn and improve user interaction on the platform. Click to read more
Tool used: SQL

Identifed factors driving declining user engagement
Analysis of A/B Testing for New Feature in Microsoft Viva Engage
This project focused on analyzing the outcomes of an A/B test conducted to assess the effectiveness of a new feature in Microsoft Viva Engage. Through examination, methodological errors were identified, prompting a closer investigation into user treatments. By refining our understanding of the A/B test results, we aimed to make informed recommendations regarding the deployment of the new feature within the platform. Click to read more
Tool used: SQL

Identified issues to enhance feature implementation
Predictive Pricing Model for Airbnb Properties
The project tackled the business problem of identifying the most optimal investment strategy for acquiring, restoring, and listing old buildings on Airbnb. Utilizing Python and Machine Learning techniques, a linear regression as well as a clustering model was developed with data scraped from the Airbnb website. These models aimed to pinpoint the most influential features of apartments contributing to higher prices and inform strategic decision-making to maximise retrun on investment.
Tools used: Python, Machine Learning
Identified key factors influencing Airbnb listing prices with Machine Learning

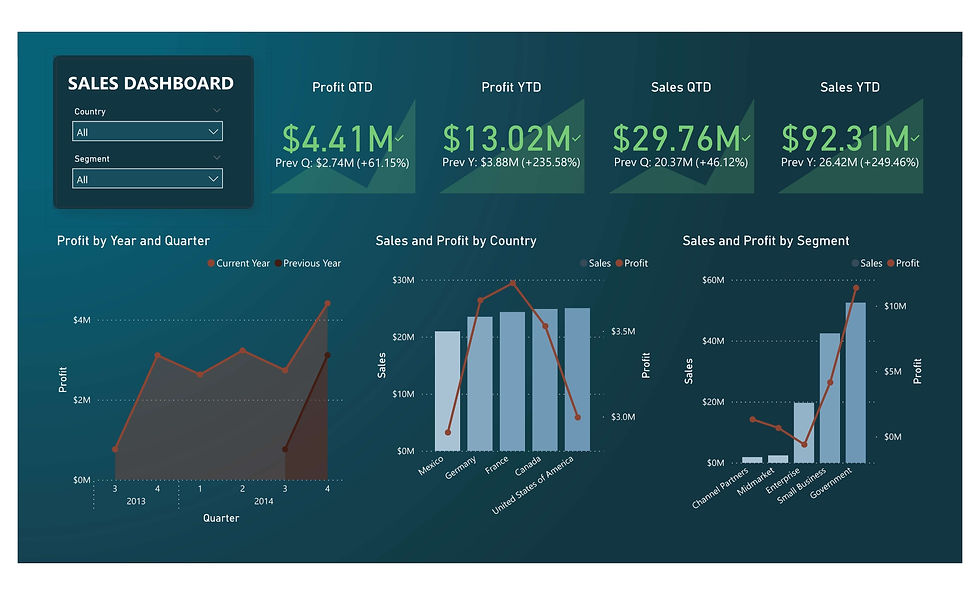
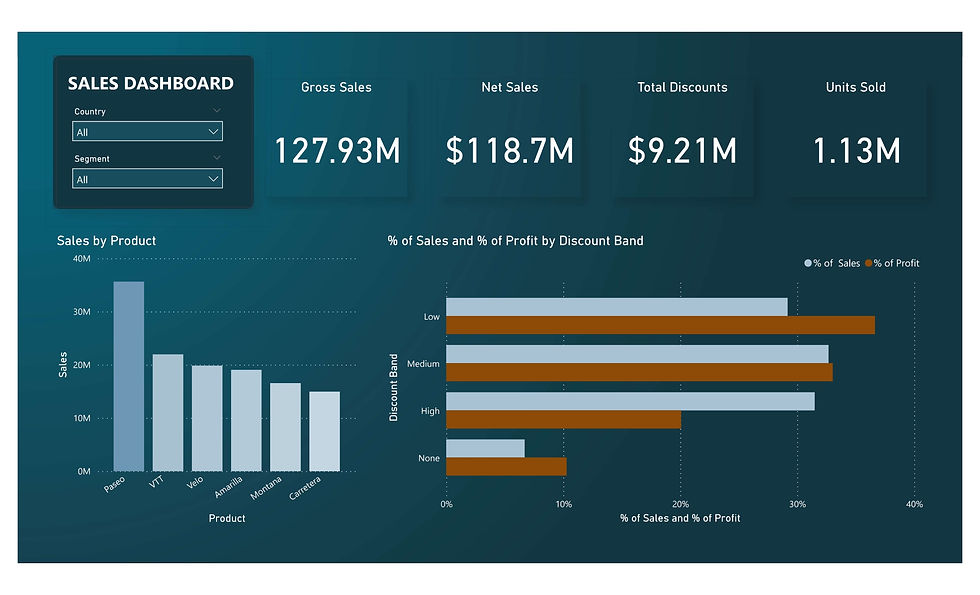
Interactive Sales Analysis: Power BI Dashboard
This Power BI sales analysis dashboard contains custom-designed Profit and Sales KPI indicators, powered by DAX coding, allowing monitoring of the company's financial performance and growth across user-defined time frames. With intuitive sorting and filtering options based on criteria like countries, segments, and products, it provides a snapshot of key business metrics, catering to the analytical requirements of both technical and non-technical stakeholders.
Tool used: Power BI
Developed custom visuals for KPI monitoring. Click on the image to view the full report -->
Analysing NYPD 'Stop, Question and Frisk' Data
This project entails exploring the NYPD 'Stop, Question and Frisk' database, with a focus on downloading, inspecting, and preparing the data for analysis using the Pandas library. The preparation phase involves meticulously examining and modifying the dataset to ensure coherence and integrity for subsequent analysis. The ultimate goal is to analyze the data to uncover insights into the contentious stop-and-frisk program, shedding light on its implications and potential biases.
Tool used: Python
Prepared and merged sizable year-wise datasets for analysis of NYPD's program

Marvel Characters Database Creation
The project involved the creation of a Marvel database, using the Beautiful Soup library in Python to extract character data from Marvel's API. This process facilitated the compilation of a comprehensive database containing general information and powers of the characters. Additionally, the database could be customized to include characters from users' favorite selected series.
Tool used: Python
Built a Python database by connecting to the Marvel API

Churn Prediction with Machine Learning
This project addressed the high churn rate of customers (14.5%) for a telecom company by developing a Machine Learning model to predict and understand churn reasons. Insights from the supervised classification model created were leveraged to devise targeted retention strategies to reduce the churn rate and generate an estimated $200,000 in revenue within the first month.
Tool used: Machine Learning
Identified methods to decrease churn and boost revenue using ML