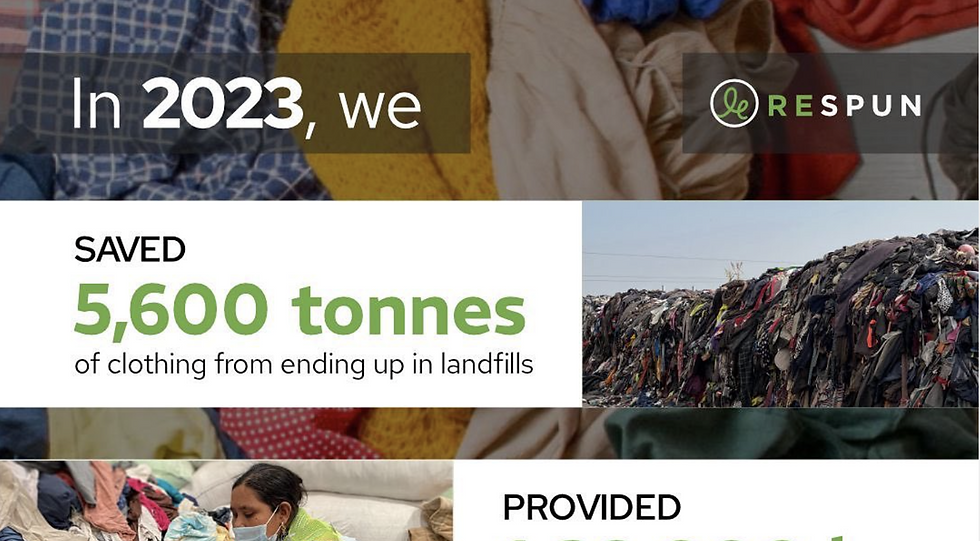
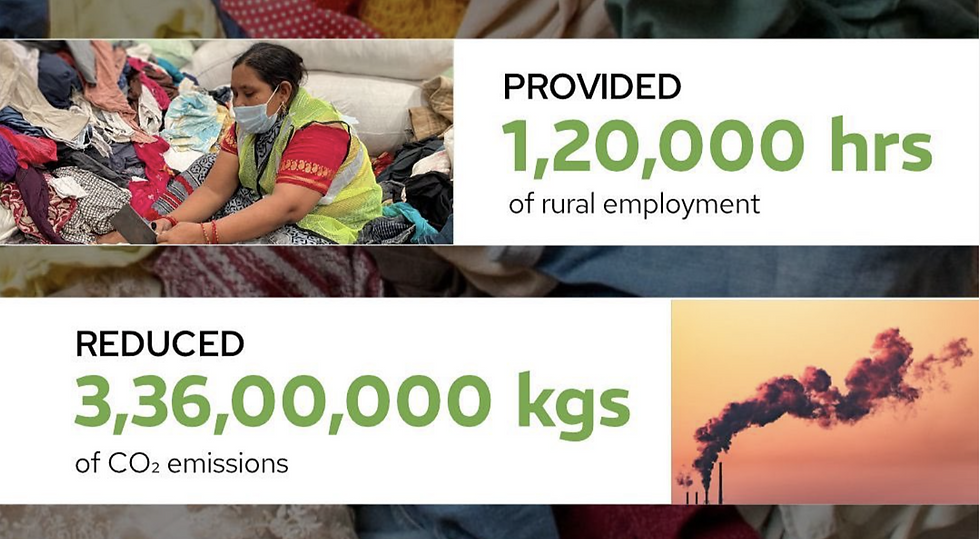
Data-Driven Sustainability: GHG Calculator for Waste Management
This collaboration with a data-driven waste management firm aimed to create a Greenhouse Gas (GHG) calculator in Microsoft Excel, quantifying emissions associated with their textile waste management procedures. Utilizing Power BI for data visualization and analysis, actionable insights were derived, enabling the client to pinpoint areas for reducing their carbon footprint and achieving sustainability gains. This solution boosted client acquisition and retention, driving significant business growth.
Tools used: Power BI, Microsoft Excel
Increased client acquisition, retention and sustainability metrics for the organisation
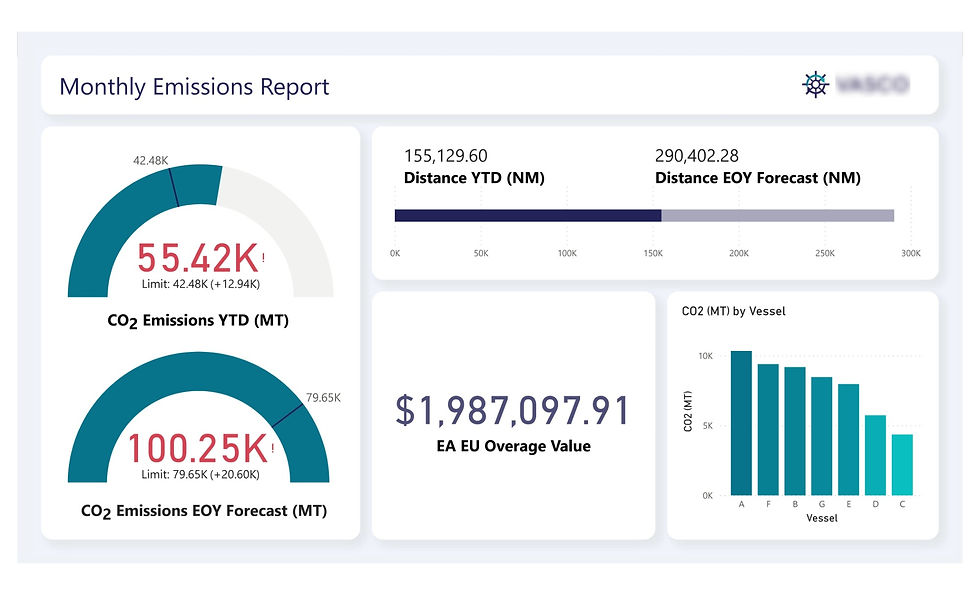
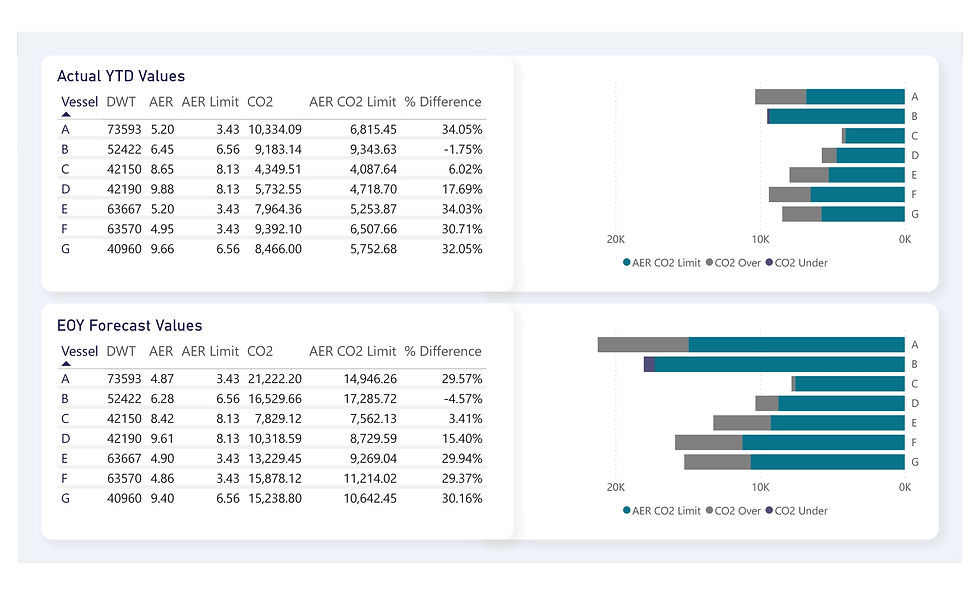
Shipping Emissions Insight: Power BI Report
The project entailed the creation of a comprehensive monthly emissions report using Power BI for a shipping company. The client's requirement was to have an easily understandable and visually appealing report that provided insights into the current and forecasted emissions of their vessels, in adherence to set limits. Additionally, the report incorporated details on financial penalties incurred due to exceeding emission limits, alongside total distance covered by the vessels.
Tool used: Power BI
Simplified critical data into understandable visuals for the client. Click on the image to view the full report -->
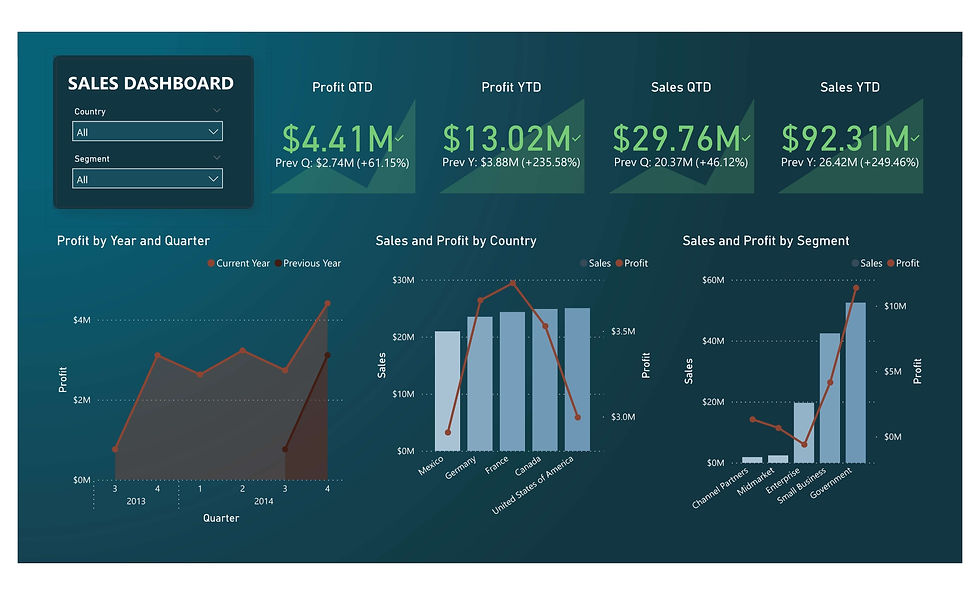
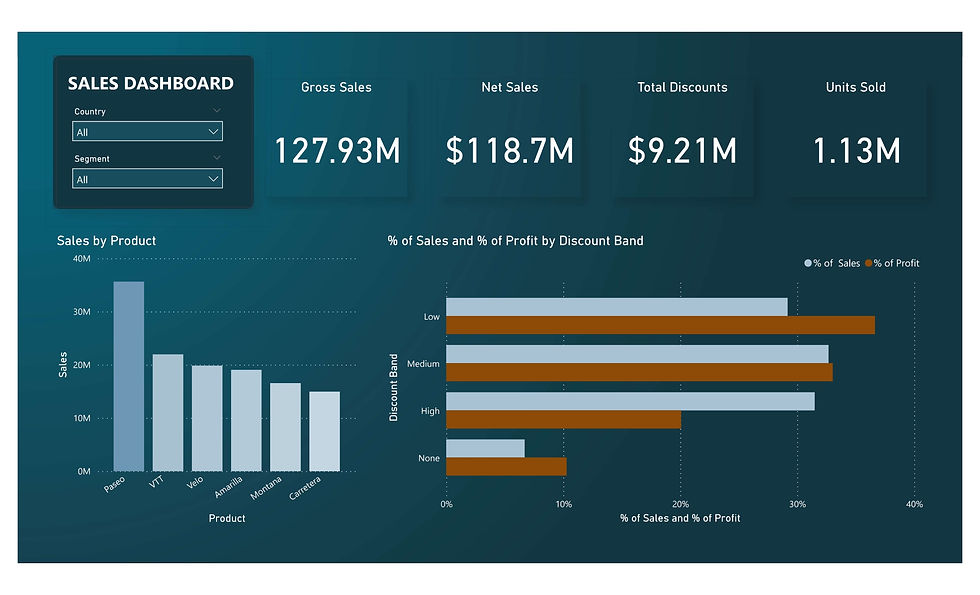
Interactive Sales Analysis: Power BI Dashboard
This Power BI sales analysis dashboard contains custom-designed Profit and Sales KPI indicators, powered by DAX coding, allowing monitoring of the company's financial performance and growth across user-defined time frames. With intuitive sorting and filtering options based on criteria like countries, segments, and products, it provides a snapshot of key business metrics, catering to the analytical requirements of both technical and non-technical stakeholders.
Tool used: Power BI
Developed custom visuals for KPI monitoring. Click on the image to view the full report -->